Over the past few
This time, we’re adding a new metric to GetSocial Analytics — Recirculation. This one has been in the works for some time and now that it’s finally live, we’re excited to enable it in your accounts.
But first, let us explain what it’s all about and why we decided to develop it.
What is Recirculation?
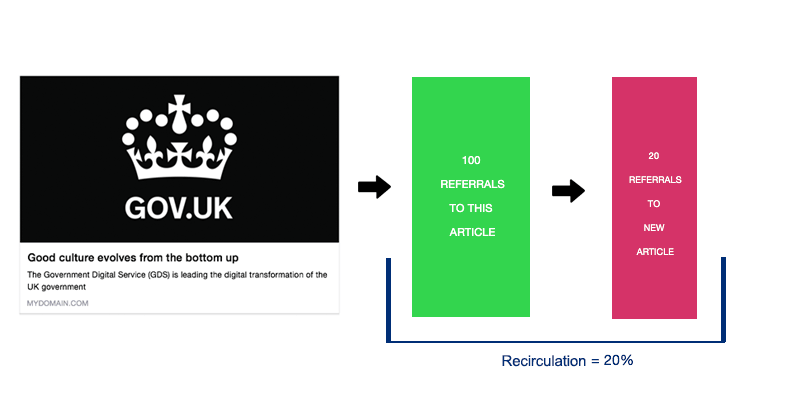
Recirculation measures the percentage of website visitors who visited an article and then visited another page/article, within the same session. It’s a simple yet extremely valuable metric for publishers, as it helps understand user loyalty.
Why is Recirculation important?
In a recent survey with over 120 digital publishers (conducted by Ezoic), it was found that the biggest challenge in 2018 for publishers was growing quality traffic, followed by growing revenue.
These two go hand-in-hand, as a publisher’s main source of revenue is its visitors. Not just any visitor: those who actually engage with the content and come back later for more.
That being said, a high bounce rate is any publisher’s nightmare. Moreover, a visitor that stays on the site no longer than a few seconds adds little to no financial value to the publisher.
In some cases, high bounce rates and the likes are perfectly normal and might not necessarily affect the business. For a publisher, it’s not ideal.
Say someone comes across an article on social media and enters your website to read it, only to leave without interest in any other content. This leads to a very low recirculation percentage. Although it might be a normal occurrence, a digital publisher wants (and needs) more than that first click.
Success equals users visiting more than one page and increasing their session time.
Now, keep in mind, Avg. Time on Page is one of those metrics that often doesn’t show the whole story, much like Bounce Rate and Avg. Session Duration. Although potentially helpful, these don’t actually tell you how your content is performing in terms of keeping users engaged.
Hence: Recirculation.
It goes beyond page views and the number of shares by showing you how well an article is retaining its users.
It’s possible that a page has a good amount of visits but very little recirculation, which means it’s not doing a good job at capturing your reader’s attention to the rest of your content.
User loyalty is extremely valuable for publishers and its key metric is recirculation, though it can be difficult to keep track of it in classic analytics platforms. As it goes up, so does user retention, which means visitors are spending more time on your site and therefore better monetizing their session.
How can I use my Recirculation data?
When an article has a high Recirculation rate, you can then try to understand which pages or articles were visited next.
From here, a few other relevant questions arise for Audience Developers, Editors, Journalists, Content Managers, and the likes…
- What does the average visitor flow look like?
- If someone comes to an article from Facebook and has a certain behavior on the site, is it the same for everyone else who comes from Facebook? How does it change when they come from Twitter?
- If different people have different behaviors, how can we segment and target them?
Understanding your readers’ behavior means you can more easily predict what content they’re most likely to click on next. Essentially, what’s going to make them stick around based on the initial article they wanted to read.
We’ve all clicked on an article because it was recommended while we were reading something else, right?
These “Recommended Stories” can be done manually or algorithmically. In the case of doing it manually, recirculation data should be a good starting point to understand which other articles the user might want to read. From there, it’s much easier to improve the section based on the results.
It’s a constant refinement that, if done well, can have a massive positive impact on a publisher’s success.
Other use cases for Recirculation data:
- Newsletter curation — how much thought do you put into the articles included in your newsletter? Recirculation metrics can guide through which groups of articles are more likely to keep users engaged, all in one email.
- Posting on social media — publishers who post several times a day can sometimes end up sharing too much content on social media, or choosing one article to promote based on assumption instead of data. With recirculation data, you can push out the content that actually retains users when Page Views fail to give you a conclusion.
- See, for each article, which social network had highest recirculation (even Dark Social channels)
- Get a better understanding of which content performs best
- Understand how you can improve your page layout — it’s not just about content, but also the way you position it on your site. Users may be interested in reading that one other article you recommended at the bottom of the page, but did they even make it there? When articles are bringing amazing results in page views and shares, but very little recirculation, you might want to rethink your strategy for further capturing the reader’s attention.
How can GetSocial help you?
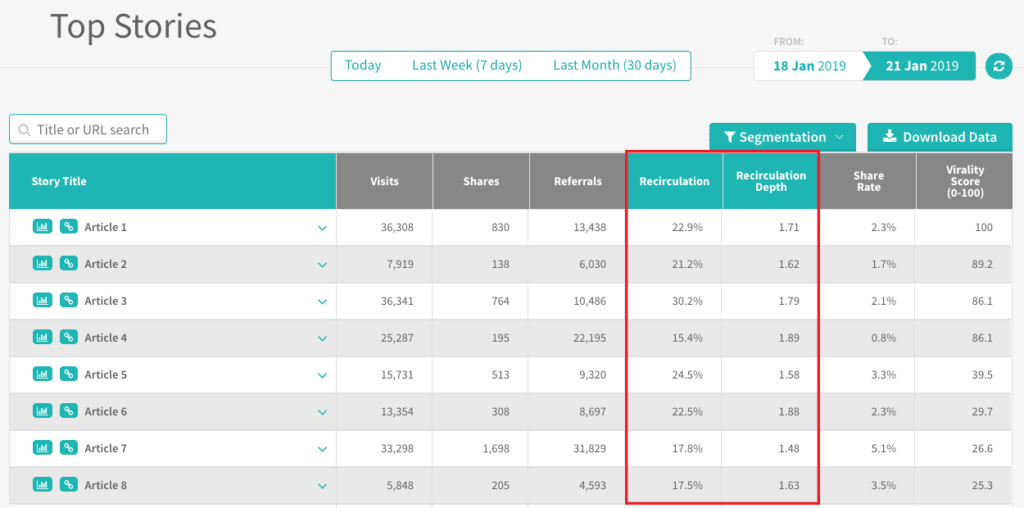
Besides Recirculation %, which we’ve already covered, we’re also giving you Recirculation Depth.
If recirculation is happening on a site, a further data point for a publisher is the depth at which it’s happening. This represents the number of pages a user views on the session.
In the example below, the user visits an article through a social referral and then has 2 more page views to other articles. Therefore, the recirculation depth in this particular session is 2.

This is interesting data to look at if you’re trying to understand how you can increase the average number of pages a user visits.
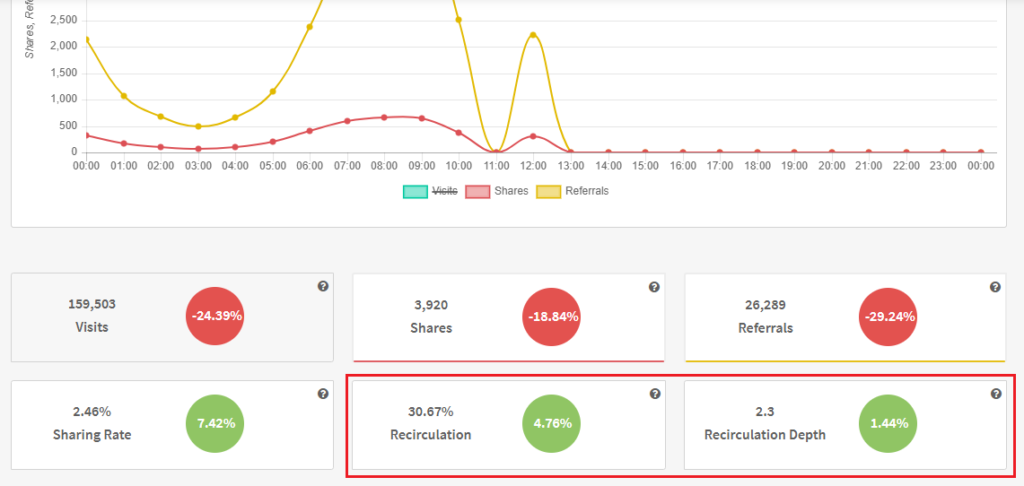
Our users will find these two metrics in the following boards: Dashboard, Stories (+ Channels within a story), Channels and Influencers.
This feature will allow us to develop further work in other existing features, like Automation and Link Shortener, but also new ones such as Recommended Stories.
It’s available for all Insights and Expand users. If you’d like to talk to us about this, reach out at support@getsocial.io or schedule a demo!
Interested in knowing more about Dark Social & Analytics?
[su_button url="https://getsocial.io" target="_blank" style="flat" background="#21D2B5" color="#ffffff" size="7" wide="no" center="yes" radius="auto" icon="" icon_color="#FFFFFF" text_shadow="none" desc="" onclick="" rel="" title="" id="" class=""]SIGN UP FOR FREE[/su_button]